Microscopic Structural Modeling of Colored Pencil DrawingsWhy colored pencil drawings? In general, traditional synthetic images tend to cause eye fatigue for the viewer, since in the images all of the points are in focus, thus giving the impression that they had been painted uniformly. As a solution to this problem from an artistic point of view, colored pencil drawings (CPDs) should attract more attention also from the CG community, because of their intrinsic nature to produce a gentle ``look & feel'' for human eyes. One of the salient features of CPDs is that high-level depiction and controllability can be achieved by a proper choice of papers, and pencil holding, sharpening and movement[1]. Therefore, it is becoming commonly acknowledged that CPD has become an artform in its own right, and is considered to be a challenging theme of advanced CG modeling in the area of digital painting. CPDs could be emulated on screen by combining various functions provided by existing commercially-available digital paint systems. At present, however, there exists no system that directly supports the CPD techniques.
Modeling paper microstructure Fig. 1 illustrates a microscopic vertical cut view of a piece of paper. Papers are generally composed of multiple layers of globally-oriented, but locally-random sparse fiber nets, whose spaces are filled partially with talc for surface smoothness. A fiber net is modeled geometrically by instantiating defaced, napped and constricted cylinders. On the other hand, a constrained blobby approach is taken to model the distribution of talc. Such a microstructure of papers is then 3D scan converted into a thin volume model, whose field value indicates the density of a paper component or pigment. The resulting paper volume is volumetrically ray traced to simulate paper semitransparency and subsurface scattering (Fig. 2). A volume visualization and graphics software system called VolVis ver. 2.0 [2] is used for the purpose of rendering.
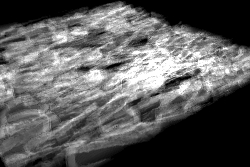
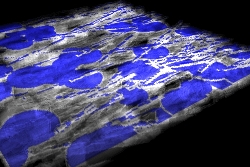
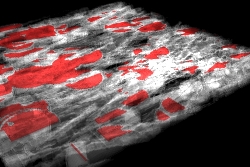
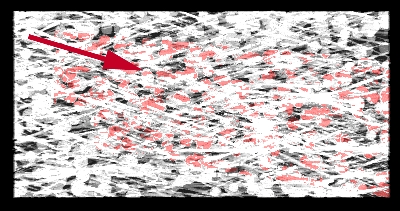
Modeling pigment distribution Fig. 3 shows three perspective views of the microstructure of a square piece of paper, (a) drawing without pigment; (b) virtual effect of graphitizer; and (c) drawing with a single color of pigment. The graphitizer is a well-known tool commonly used in the paper science for evaluating the texture of papers by press coating a special kind of pigment uniformly on pieces of paper. It can be seen also here from the center and right images respectively that the virtual graphitizer reveals the fiber nets more clearly, while in the regular drawing, most of the pigment is accumulated in the concave regions lying on the fore side of fibers with locally maximal height with respect to the pencil stroke direction. Furthermore, in both cases, it is revealed that pigment is more likely to be attached onto surface areas covered with talc, because these relatively flat areas possess lower ODA values, and talc has a relatively high pigment-adsorption rate (Fig. 1). Such pigment distribution patterns qualitatively coincide with physically observed ones. An example of macroscopic view of the resultant CPD is shown in Fig. 4.
Modeling pigment redistribution with water A 3D extension of the LIC (Line Integral Convolution) algorithm [4], combined with the ODA concept could be the best candidate for calculating the effect of spreading and blending of brush-reachable pigments with water on or near the surface of the paper volume.
References
Saeko Takagi( takagi@imv.is.ocha.ac.jp) and Issei Fujishiro( fuji@imv.is.ocha.ac.jp) Ochanomizu Univ., Tokyo JAPAN |